01
See visits and clicks together
The Studio Analytics view presents profile activity over selectable periods so you can compare page attention with the actions visitors take.
Link in bio analytics
Linkrise Pro turns profile traffic into a practical view of visits, clicks, top links, source context, devices, countries, and QR scans. Use the data to improve hierarchy and campaign decisions without pretending every click is a sale.
For creators, consultants, shops, and teams whose link page has become an active acquisition or campaign surface.
01 · How it works
Analytics becomes useful when it changes a decision. Choose the page or campaign question first, then read the smallest set of metrics that can answer it.
Compare profile views with total link clicks to understand whether visitors continue beyond the page. Treat the relationship as a diagnostic signal, not a universal conversion benchmark.
Use per-link reporting and the top-link view to see whether the primary action actually receives attention or whether a supporting destination is unexpectedly more useful.
Review source, device, country, time period, and QR attribution where available. A campaign or audience shift can change the numbers even when the page itself has not changed.
02 · Free and Pro
The Studio Analytics view presents profile activity over selectable periods so you can compare page attention with the actions visitors take.
Per-link reporting identifies which active Linkrise blocks receive clicks. Source, country, and device summaries provide context without exposing a list of individual visitors.
Pro can attribute scans from Linkrise's tracked QR path separately, helping print, packaging, event, and offline placements avoid disappearing into the general traffic total.
03 · Practical examples
Place the primary offer first and the supporting media or newsletter below it. Per-link results can show whether visitors follow the intended hierarchy or consistently choose a different path.
Use the public page in social profiles and a Linkrise tracked QR on printed material. Separate QR attribution helps explain whether offline placements are contributing page visits and clicks.
Compare equivalent periods before and after changing the first block, while checking source and device mix. If the audience changed at the same time, avoid attributing the whole difference to the design.
What to know
Privacy controls, bots, network behavior, blocked requests, attribution limits, and destination systems can all affect the numbers. Use trends and repeated comparisons instead of treating one total as perfect truth.
Repeated visits, browser behavior, filtering, and measurement rules mean profile views should not be interpreted as a count of unique verified humans unless the interface explicitly says so.
Apps, privacy protections, redirects, and direct navigation can remove or simplify source information. Unknown or direct traffic is a normal part of web analytics.
Linkrise can report a click leaving the page. The shop, booking service, newsletter provider, or payment platform must report whether that visitor completed the external action.
Plan the page
Useful analytics starts with a question and a controlled change. The goal is not to collect the largest dashboard, but to understand which page decisions help visitors find the next step.
Decide whether you are testing hierarchy, wording, campaign timing, source quality, or device experience. Then change as little as possible and compare equivalent periods. If the top block, traffic source, promotion, and audience all change together, the result cannot explain which factor mattered. Record the page revision and campaign dates outside the dashboard when a decision is important enough to revisit later.
Profile views show that the Linkrise page was reached under the platform's measurement rules. Per-link clicks show which tracked destinations were opened from that page. Neither metric proves a unique person or a completed external action. A high-view, low-click page may have a weak promise, unclear hierarchy, mismatched traffic, or visitors who found enough information without leaving. Review the page itself before assuming the audience is low quality.
Referrers can be missing when apps, privacy controls, redirects, or direct navigation remove source details. Device and country signals are directional rather than identity records. Linkrise does not currently expose Google Analytics or Meta Pixel installation as a public integration, so this page does not claim cross-site ad attribution. Use Linkrise for profile navigation patterns and connect final revenue, bookings, subscriptions, or form submissions inside the destination systems that own those events.
Before you publish
Use the same questions each time so dashboard changes lead to careful decisions instead of reactive page edits.
Profile previews
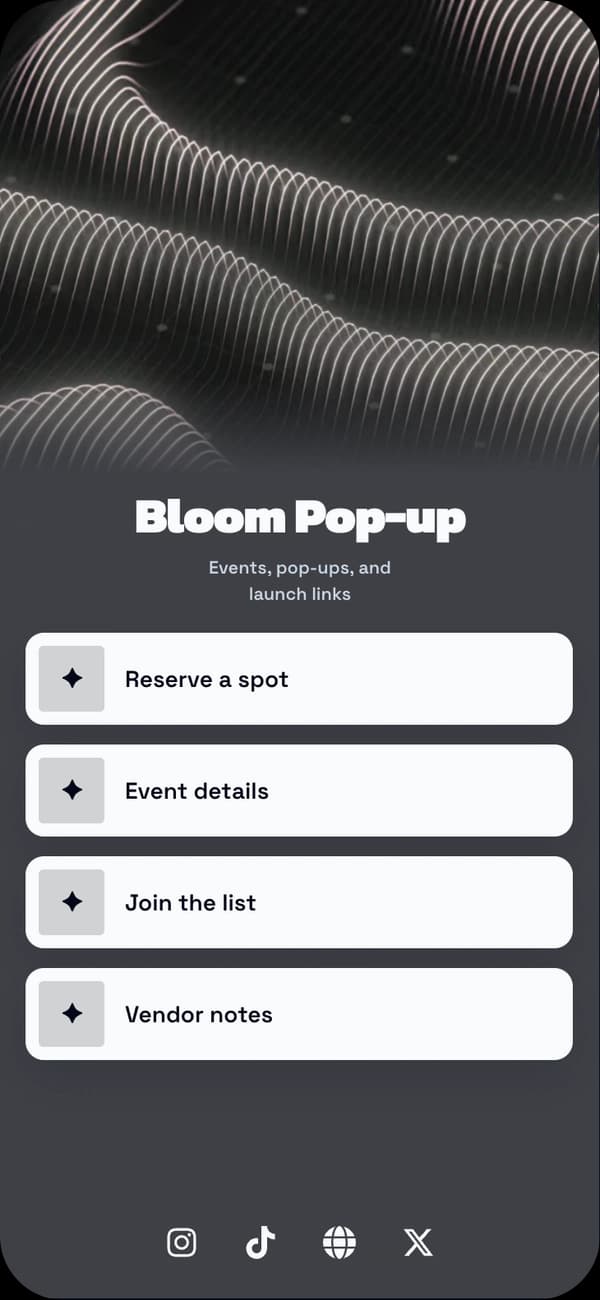
A prominent first-action layout suited to campaigns where hierarchy is easy to test.
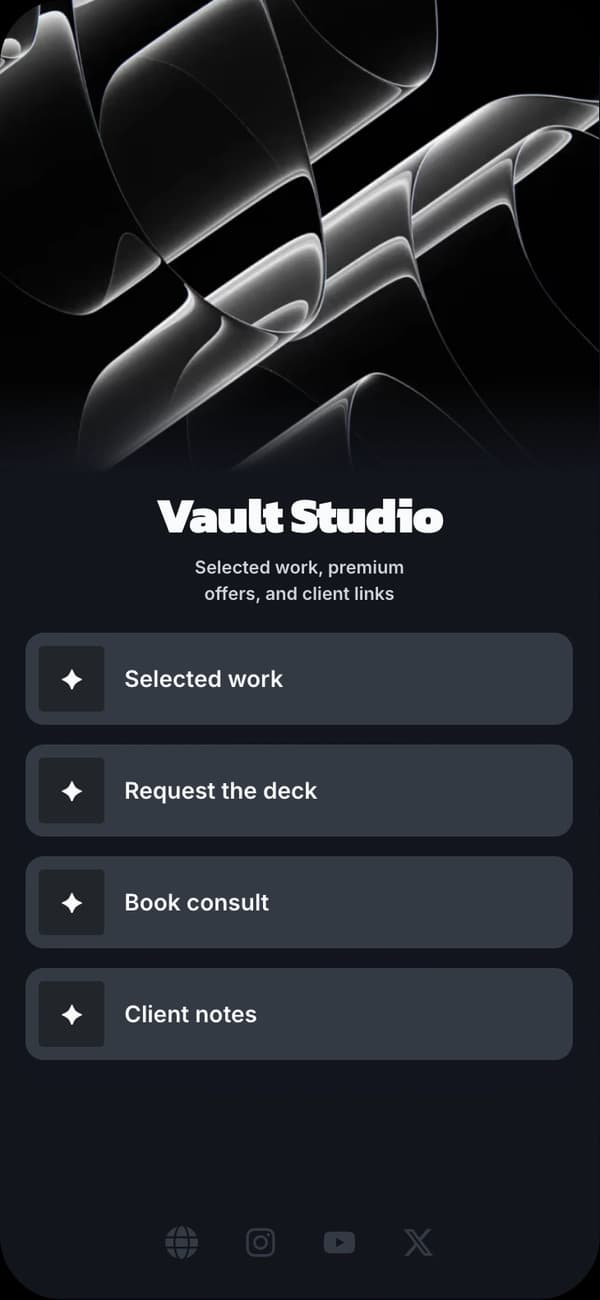
A restrained structure for services, professional offers, and repeated campaigns.
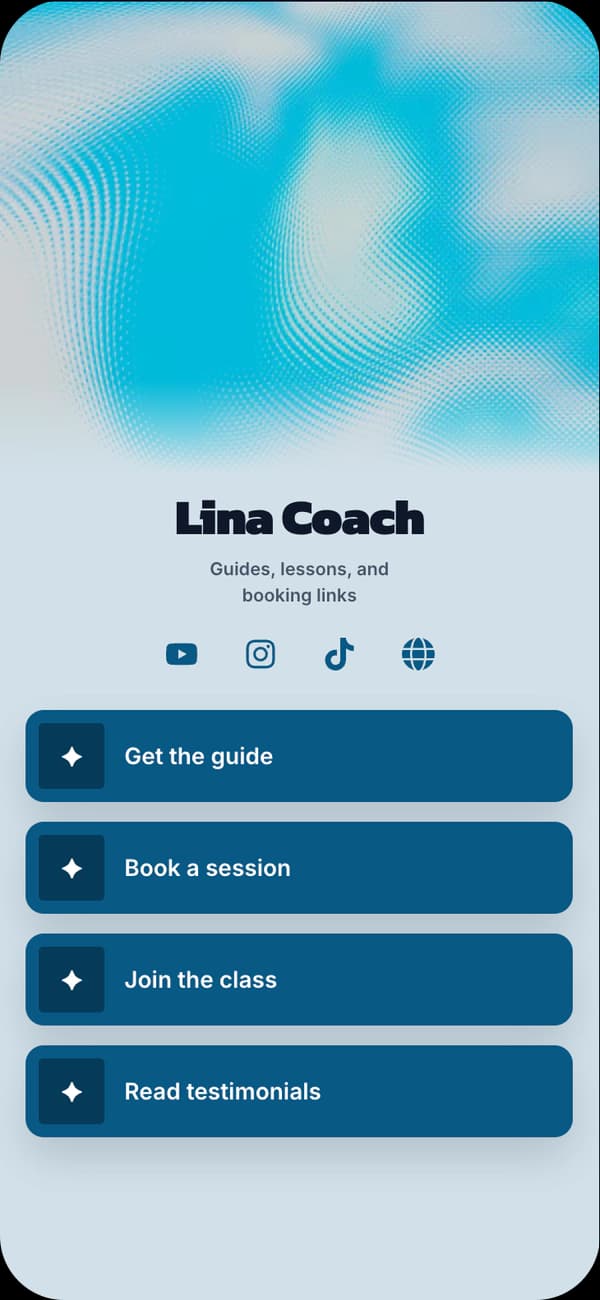
A clean profile for comparing resources, products, communities, and contact paths.
FAQ
Current Pro analytics includes profile views, link clicks, per-link performance, time trends, source context, country and device summaries, and separate attribution for Linkrise tracked QR scans.
No. A Linkrise click records the next action on the Linkrise page. The destination service must provide its own purchase, booking, signup, or revenue confirmation.
No. Google Analytics and Meta Pixel integrations are not part of the current Linkrise launch scope. Do not assume third-party advertising attribution is present.
No. The product is designed around aggregated page and link performance rather than an identifiable visitor list. Some context can also be unavailable or classified as unknown.
Explore next
Compare Full Analytics, per-link reporting, QR attribution, page limits, branding removal, and trial terms.
Review ProUse a provider-neutral framework for evaluating analytics, page control, trust, localization, and upgrade boundaries.
Read the measurement guideConnect the promise in a social post to the first action visitors see on the profile page.
Improve the pageStart on Free